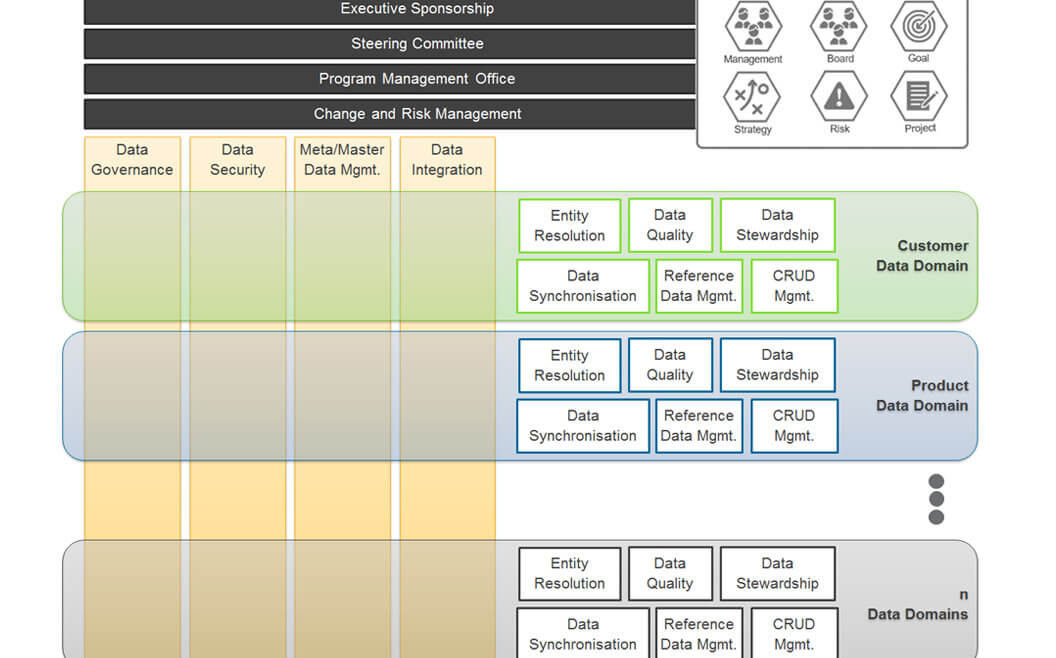
The cross domain model (Allen and Cervo 2015, 7) outlines the expected complexity, and figure 47 is an applied version that covers specific domains mentioned in section 2.5, “Master Data Management as IT Trend,” but it has also applied the transition team from the TESy figure.
Facebook Comments

Leave a Reply